What is a PQ Curve and how is it generated?
Understanding the PQ Curve: A Critical Metric for Fan Performance
When selecting a fan for any engineering system, simply knowing its size and RPM is not enough. The true indicator of performance lies in the PQ curve, a fundamental tool that illustrates how a fan behaves under varying operating conditions. For system designers and engineers understanding and interpreting this curve is essential for achieving optimal system performance.
What is a PQ Curve?
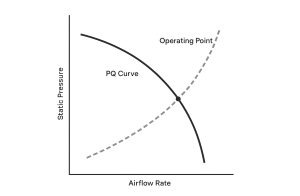
The PQ curve (Pressure-Quantity curve) is a graphical representation of a fan’s operating characteristics. It plots the relationship between static pressure and airflow rate.
Static Pressure (P) – The resistance the fan must overcome to move air through a system, typically expressed in Pascals (Pa) or inches of water column (inH₂O).
Airflow Rate (Q) – The volumetric flow rate of air delivered by the fan, commonly measured in cubic meters per hour (m³/h) or cubic feet per minute (CFM).
The PQ curve illustrates the inverse relationship between airflow rate and static pressure. As static pressure increases, due to obstructions, longer duct runs, or clogged filters the fan must expend more energy overcoming this resistance. Consequently, less energy is available to maintain volumetric flow, causing a reduction in airflow. This trade-off is fundamental to fan operation: higher resistance environments limit a fan’s ability to move air effectively, which directly impacts cooling performance and overall system efficiency. If air can’t flow, then cooling will not be achieved.
Why the PQ Curve is Indispensable
Understanding a fan’s PQ curve provides actionable insights that go beyond basic specification matching. It empowers engineers and system designers to optimize performance, energy use, and long-term reliability. Key benefits include:
1. Fan-to-Application Matching
Every application, whether it’s ventilation in a cleanroom, cooling in a server enclosure, or exhaust in an industrial process, has its own system resistance profile, typically expressed as a system curve (a plot of pressure loss vs. airflow). By overlaying the system curve with a fan’s PQ curve, designers can identify the operating point, where fan performance intersects system demand. This ensures:
- The fan operates within a stable and efficient region.
- There’s minimal risk of over- or under-sizing, which can lead to issues such as excessive power consumption, noise, vibration, or insufficient airflow.
- System startup and operational conditions (like dirty filters or damper changes) are considered during fan selection.
2. System Efficiency Optimization
The Best Efficiency Point (BEP) on the PQ curve represents the fan’s most energetically favorable operating condition. At the BEP:
- The fan impeller and motor experience minimal mechanical stress.
- Turbulence and recirculation losses are minimized.
- Power input per unit airflow (e.g., Watts/CFM) is at its lowest, translating to reduced operating costs.
Selecting a fan that operates as close as possible to its BEP ensures lower energy consumption, reduced maintenance frequency, and longer operational life. BEP can be calculated by multiplying the static pressure (P) and flow rate (Q) values together, then when the results are plotted against the Q scale the fan’s BEP can be determined from the largest value.
3. Predictive System Modeling
Fans rarely operate in static conditions. Ducting may be reconfigured, filters may clog, ambient air density may vary with altitude or temperature. The PQ curve is a foundational tool for modeling these real-world dynamics. For example:
- Filter Loading: As filters accumulate debris, static pressure increases. The PQ curve lets designers predict the resulting airflow drop and ensure that cooling or ventilation remains within acceptable thresholds.
- Altitude Adjustments: Air density decreases at higher elevations, affecting pressure losses and fan performance. With PQ curves and correction factors, accurate de-rating can be performed.
- Variable Speed Control: For systems using EC fans or speed control methods like PWM, different fan speeds yield a family of PQ curves. These curves help determine how performance shifts across speeds, enabling dynamic control strategies for energy savings and adaptive airflow regulation.
How is a PQ Curve Generated?
The generation of a PQ curve involves controlled laboratory testing under standardized conditions, such as those defined by AMCA 210 or ISO 5801. Here’s a technical overview of the procedure:
- Test Setup: The fan is installed in a test rig or wind tunnel designed to simulate actual operating conditions while isolating external variables.
- Pressure Variation: The static pressure at the fan’s outlet is incrementally increased—typically using throttling devices, dampers, or orifice plates.
- Airflow Measurement: At each pressure setting, airflow is measured using calibrated flow sensors or nozzles. Parameters such as ambient temperature, barometric pressure, and air density are also recorded to normalize the results.
- Data Plotting: The measured data points are plotted, resulting in a curve that slopes downward from maximum airflow at zero pressure to zero airflow at the fan’s shutoff pressure.
- The curve is not linear; its shape is influenced by several design factors, including impeller geometry, blade angle, housing configuration, and motor performance.
Interpreting the PQ Curve
The PQ curve provides a wealth of information about a fan’s performance envelope. By understanding its shape and key points, engineers can make informed decisions during design, troubleshooting, and optimization. A typical PQ curve has three primary regions:
1. Free Delivery Point (Zero Static Pressure)
This is the point at which the fan operates under no external resistance, the discharge path is unrestricted, and the fan experiences zero static pressure. At this point, the fan delivers its maximum volumetric airflow (Q_max), typically expressed as CFM or metric units.
While the high airflow may seem ideal, operating at this point is often inefficient and unrepresentative of real system conditions. In practical systems, ductwork, filters, and other components introduce resistance, so free delivery is more of a theoretical maximum than a real-world operational point.
2. Shutoff Point (Zero Flow, Maximum Pressure)
At the opposite end of the curve, the fan is fully blocked and cannot move any air. The static pressure is at its maximum (P_max), representing the point at which no cooling is provided.
This point is useful for specifying the maximum pressure a fan can generate, but continuous operation here is undesirable. It can cause:
- Motor overheating due to high torque load
- Excessive noise and vibration
- Accelerated bearing wear and premature failure
During testing, the shutoff pressure is often used to assess the fan’s capability to overcome system startup resistance, such as in highly restrictive filter housings or dampers. Best practice dictates that fans should never be used in application conditions near or at the shutoff point.
3. Operating Range (Between Free Delivery and Shutoff)
The practical and stable zone of operation lies between these extremes. This is where the fan can maintain a balance between flow rate and pressure, aligning with the real-world resistance of the system it serves.
Every system has its own pressure drop vs. airflow curve, which typically increases with flow rate. The intersection point between the system curve and the PQ curve defines the true operating point of the fan.
Fan Selection Criteria:
- Choose a fan whose operating point falls in the steep, stable region of the PQ curve (often the lower to middle third), avoiding areas near stall or free delivery.
- Avoid flat sections of the curve, where small changes in pressure can lead to large changes in flow (risking instability).
If a system uses dampers or variable filters, the system curve may shift. Designers must ensure the fan performs reliably across a range of expected conditions, not just at a single static point.
Other Considerations:
- Steeper PQ Curves typically indicate higher-pressure, lower-flow fans, such as backward-curved centrifugal designs.
- Flatter PQ Curves are more common in axial fans, offering higher flow at lower pressure but more sensitive to system changes.
- Multi-speed or PWM-controlled fans will have a family of PQ curves, each corresponding to a different motor speed or frequency input.
Real-World Applications of the PQ Curve
The PQ curve is not just a design-phase reference; it plays a critical role across a wide range of industries and system types. From comfort air systems to precision cooling and industrial operations, accurately interpreting the PQ curve ensures reliability, efficiency, and safety.
1. HVAC Systems (Heating, Ventilation, and Air Conditioning)
In commercial and residential HVAC applications, fan performance must be tailored to the entire air distribution network; including ducts, dampers, diffusers, and filters. These components create varying levels of system resistance, which shift the system curve.
Use of PQ Curve:
- Ensures fans are selected to match the system’s pressure drop at the required airflow.
- Helps avoid oversizing (which can lead to excess energy use, and greater space requirements) or undersizing (which can result in poor ventilation, equipment strain, and higher fan noise).
Dynamic Considerations:
- Filters become more restrictive as they collect dust; the PQ curve allows designers to account for filter loading over time.
- Zoning systems or VAV (Variable Air Volume) boxes change downstream resistance, fan selection must accommodate these variations.
Consequence of Mismatch:
- Fans operating outside their stable regions can experience stall, high noise and vibration, or surge conditions, leading to early failure or uncomfortable space conditions.
2. Electronics Cooling (Thermal Management)
High-density electronics, from servers and routers to power supplies and battery packs, generate substantial heat that must be dissipated to maintain performance and prevent thermal shutdown.
Use of PQ Curve:
- Enables selection of a fan that can maintain required airflow under non-ideal, restrictive conditions, such as narrow channels or fine-mesh filters.
- Allows thermal engineers to simulate cooling behavior under worst-case scenarios like partial fan blockage or filter clogging.
Key Considerations:
- Many electronics applications operate in environments with variable intake/exhaust conditions, so the fan must perform across a range of static pressures. Some operating margin must be planned for in the system design.
- PQ curves are also vital for redundant fan systems, where multiple fans may share airflow or provide backup in failure conditions.
Integration with Controls:
- Paired with thermal sensors and PWM control or EC (electronically commutated) motors, fan speed can be adjusted dynamically based on real-time conditions, each speed corresponding to a different point on a family of PQ curves.
3. Industrial Ventilation & Process Control
In industrial environments, fans are used not just for comfort but as integral components of production processes, environmental safety systems, and contamination control.
Use of PQ Curve:
- Supports precise fan selection for applications with complex, process-dependent resistances, such as:
- Dust collection systems
- Fume extraction arms
- Drying tunnels
- Combustion air supply
- Pneumatic conveying
Challenges Addressed:
- Processes may introduce nonlinear resistance, such as sticky particulates, fluctuating backpressure, or dynamic damper positioning.
- Proper fan selection via PQ curves ensures these systems maintain operational flow even under changing load conditions.
Advanced Use:
- Engineers often overlay multiple system scenarios (e.g., startup, peak load, partial clog) onto a single PQ curve to verify the fan will maintain critical thresholds across all expected states.
- PQ curves also inform control system logic, such as triggering alarms when operating points shift due to fan degradation or filter obstruction.
- Fans that output Tachometer signals can enable detailed monitoring of fan airflow performance and fault conditions.
The PQ curve is far more than a performance snapshot, it’s a predictive and diagnostic tool that ensures correct fan selection, promotes energy-efficient operation, and supports long-term system reliability. Whether you’re designing a data center cooling solution, optimizing a manufacturing process, or retrofitting an HVAC system, leveraging the PQ curve enables informed decisions that translate to tangible performance gains.